More money per pupil
than ever. Fewer pupils
than five years ago.
This page holds the record on Colorado schools, end to end. What the state spends. Where families enroll their kids. What the scores and graduation rates show. What child care costs before kindergarten. What college costs after. Every figure names its publisher or stays blank. We draw no conclusion for you.
Updated Aug 27
School funding runs through one formula, the Public School Finance Act. Its statewide total is called Total Program. The per-pupil figure divides that total by the funded pupil count. That is a formula count, smaller than the number of children in seats. Both figures are on the main dashboard too. This is the same checked data, shown deeper.
Total Program funding rose 31.6%, from $7.60B in FY 2019-20 to $10.00B in FY 2025-26. The last year is the first under the HB24-1448 formula. The two ends of this line are not on one basis.
Total Program under the Public School Finance Act, FY 2019-20 to FY 2025-26 · dollars of each year
HB24-1448 formula phase-in begins
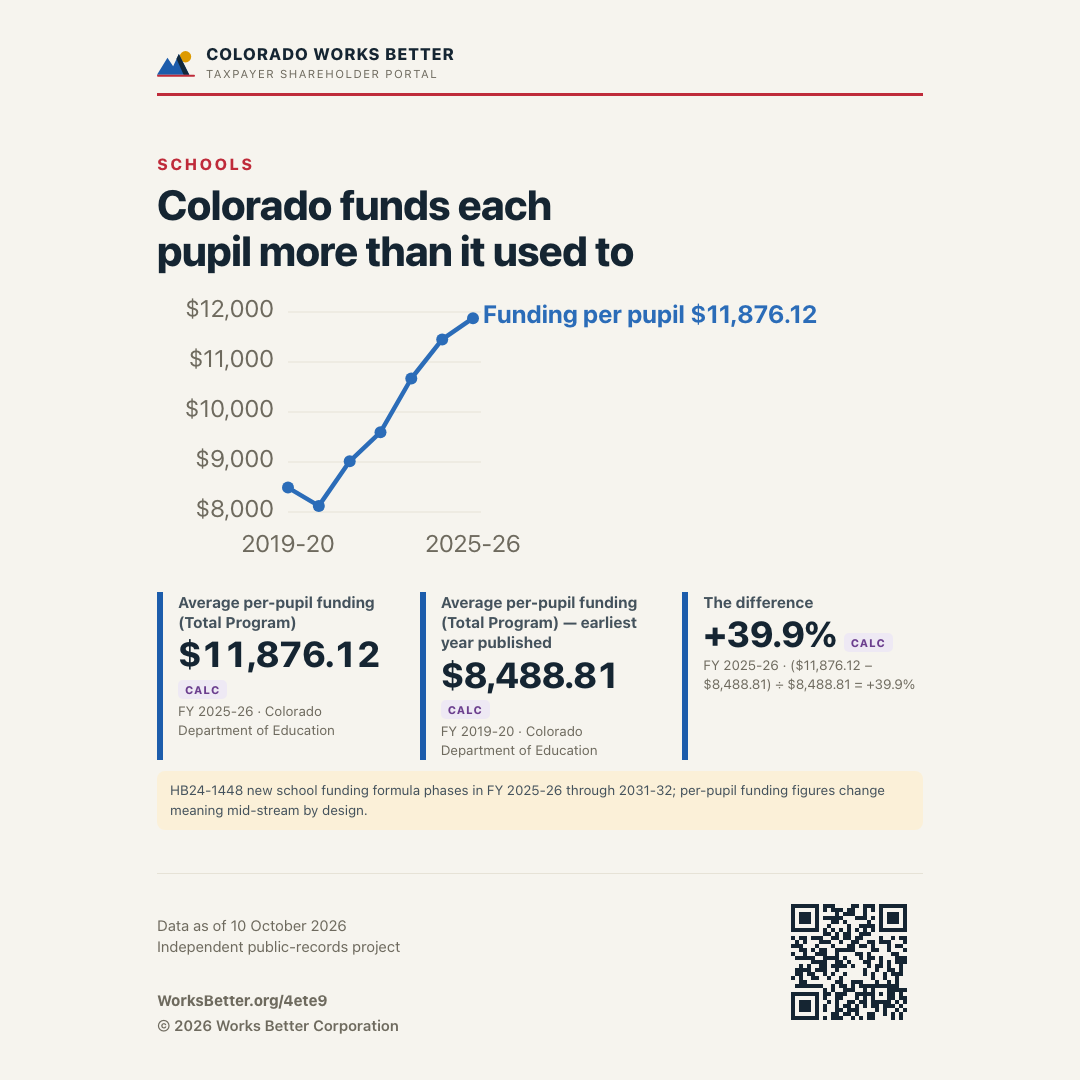
Funding per pupil rose 39.9%, from $8,488.81 in FY 2019-20 to $11,876.12 in FY 2025-26. The last year is the first under the HB24-1448 formula. The two ends of this line are not on one basis.
Average per-pupil funding under the Public School Finance Act, the state formula basis, FY 2019-20 to FY 2025-26 · dollars of each year
HB24-1448 formula phase-in begins
Your post
Colorado funds each pupil more than it used to. #ColoradoWorksBetter #TaxpayerShareholder #ShowYourWork
https://worksbetter.org/4ete9
Copy this address:
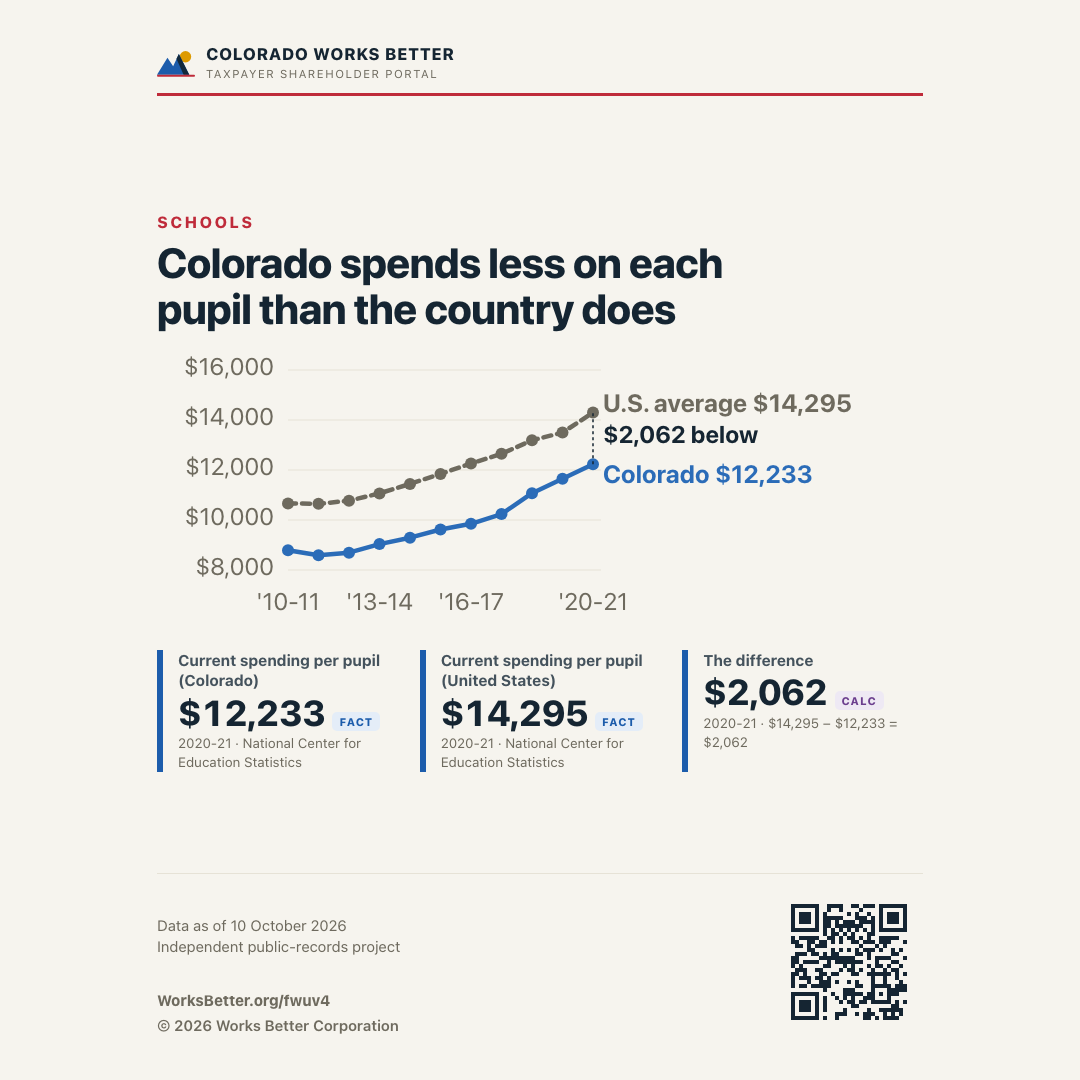
Current spending per pupil rose 39.2%, from $8,786 in 2010-11 to $12,233 in 2020-21. It ends $2,062 below the U.S. average, as in all 11 years both publish.
The federal NCES measure: all current spending divided by fall enrollment. Colorado against the U.S., 2010-11 to 2020-21. A different measure from the formula amount, and the two never share an axis.
Colorado ends $2,062 below the U.S. average.
Your post
Colorado spends less on each pupil than the country does. #ColoradoWorksBetter #TaxpayerShareholder #ShowYourWork
https://worksbetter.org/fwuv4
Copy this address:
View the money as a table — every year of all four series
| School year | Total Program | Funding per pupil | Current spending per pupil (CO) | Current spending per pupil (US) |
|---|---|---|---|---|
| 2010-11 | $8,786 | $10,663 | ||
| 2011-12 | $8,594 | $10,648 | ||
| 2012-13 | $8,693 | $10,771 | ||
| 2013-14 | $9,036 | $11,066 | ||
| 2014-15 | $9,292 | $11,445 | ||
| 2015-16 | $9,619 | $11,842 | ||
| 2016-17 | $9,849 | $12,260 | ||
| 2017-18 | $10,238 | $12,649 | ||
| 2018-19 | $11,072 | $13,189 | ||
| 2019-20 | $7.60B | $8,488.81 | $11,647 | $13,496 |
| 2020-21 | $7.20B | $8,122.75 | $12,233 | $14,295 |
| 2021-22 | $8.00B | $9,014.59 | ||
| 2022-23 | $8.40B | $9,595.45 | ||
| 2023-24 | $9.10B | $10,670.19 | ||
| 2024-25 | $9.78B | $11,452.23 | ||
| 2025-26 | $10.00B | $11,876.12 | ||
| Two per-pupil definitions, never one axis, never one name. Funding per pupil is the state formula amount: Total Program divided by the funded pupil count. Current spending per pupil is the federal NCES measure: all current spending divided by fall enrollment. The NCES series ends at 2020-21, the latest year in the Digest table this site reads — later blanks are the publisher's gap, not ours. | ||||
Sources — Colorado Department of Education: FY2025-26 District Funding Calculation Worksheet - HB25-1320 Updated January 14, 2026 (XLS) · FY 2019-20 District Funding Calculation Worksheet - June 2020 Final · FY 2020-21 District Funding Calculation Worksheet - June 2021 Final · FY 2021-22 District Funding Calculation Worksheet - June 2022 Final · FY2022-23 District Funding Calculation Worksheet - June Final 6/12/2023 · FY2023-24 District Funding Calculation Worksheet - June Final 2024 6/14/2024 · FY2024-25 District Funding Calculation Worksheet - January 13, 2025 - FINAL (XLS) · Legislative Council Staff: HB25-1320 School Finance Act — final fiscal note (11 Jul 2025) · Financing of Public Schools — annual memo archive (FY 2019-20 through FY 2023-24) · National Center for Education Statistics: Digest of Education Statistics table 236.65 (current expenditures per pupil by state, 1969-70 to 2020-21)
The two per-pupil figures defined in the table above differ by about 37% in the same year, which is why this site never draws them on one axis. A new funding formula (HB24-1448) phases in from FY 2025-26. That changes what a funding dollar means, and the series says so.
Share the point this section makes
This opens a page carrying the figures, the sources they came from, and the date the data was read. Each chart above has its own share button. Nothing is loaded from any of these services until you choose one.
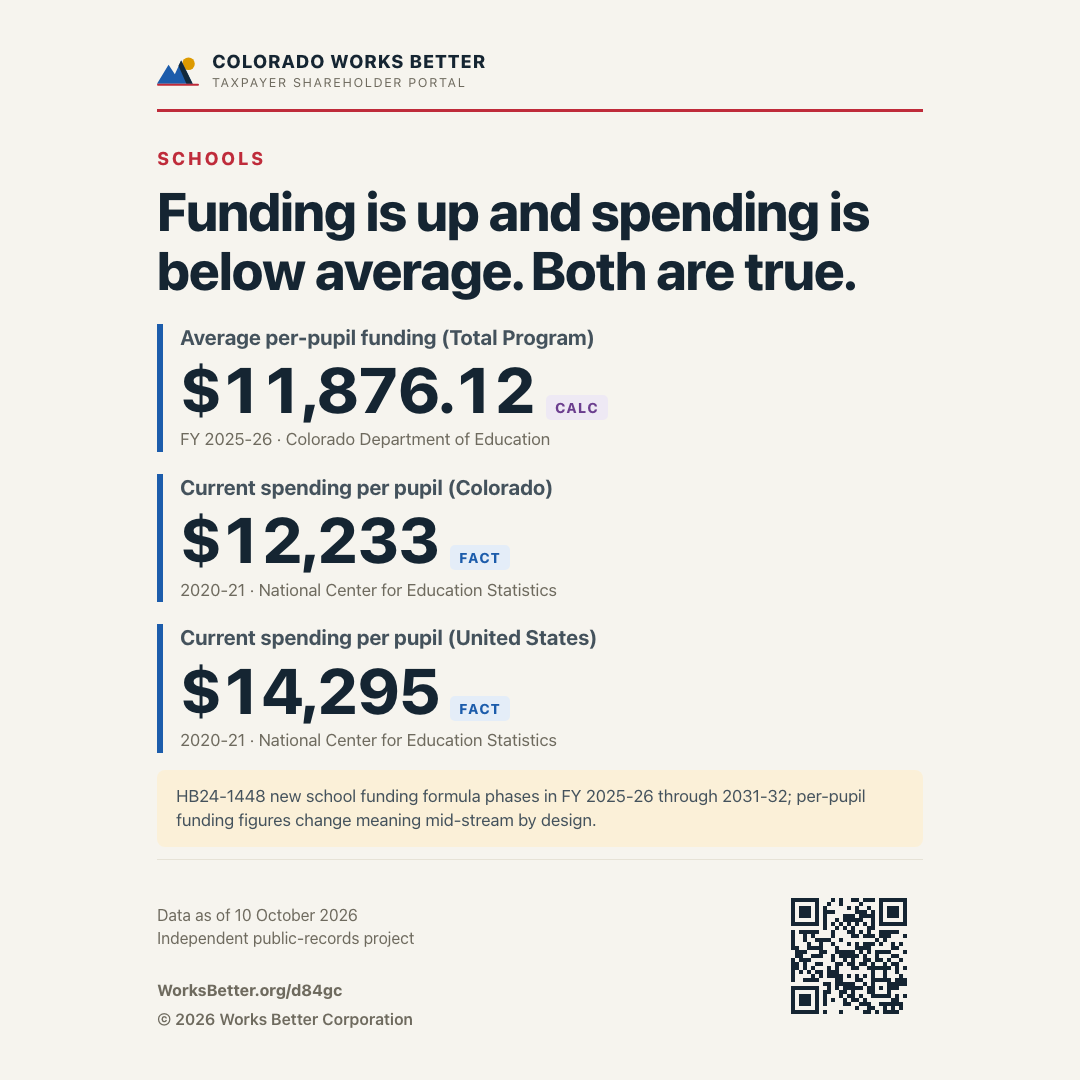
Funding is up and spending is below average. Both are true.
Your post
Funding is up and spending is below average. Both are true. #ColoradoWorksBetter #TaxpayerShareholder #ShowYourWork
https://worksbetter.org/d84gc
Copy this address:
These buttons talk to no one until you click. This page loads nothing from Facebook, X, Nextdoor, LinkedIn or anywhere else. Every button is a plain link to that service's own page, and the image is a file on this site.
Instagram has no way to share a link from a web page. On a phone, Share… hands the picture straight to it. On a computer, Instagram image saves the picture — post it, and the address printed on the picture is the link back.
Enrollment is falling. Where it lands is shifting.
FACTColorado counts every public school pupil once a year, in October. That count peaked in 2019-20 and has fallen since. Inside the falling total, three ways of schooling keep growing. Charter schools. Full-time online schools. Home schooling. The figures below are the publisher's own.
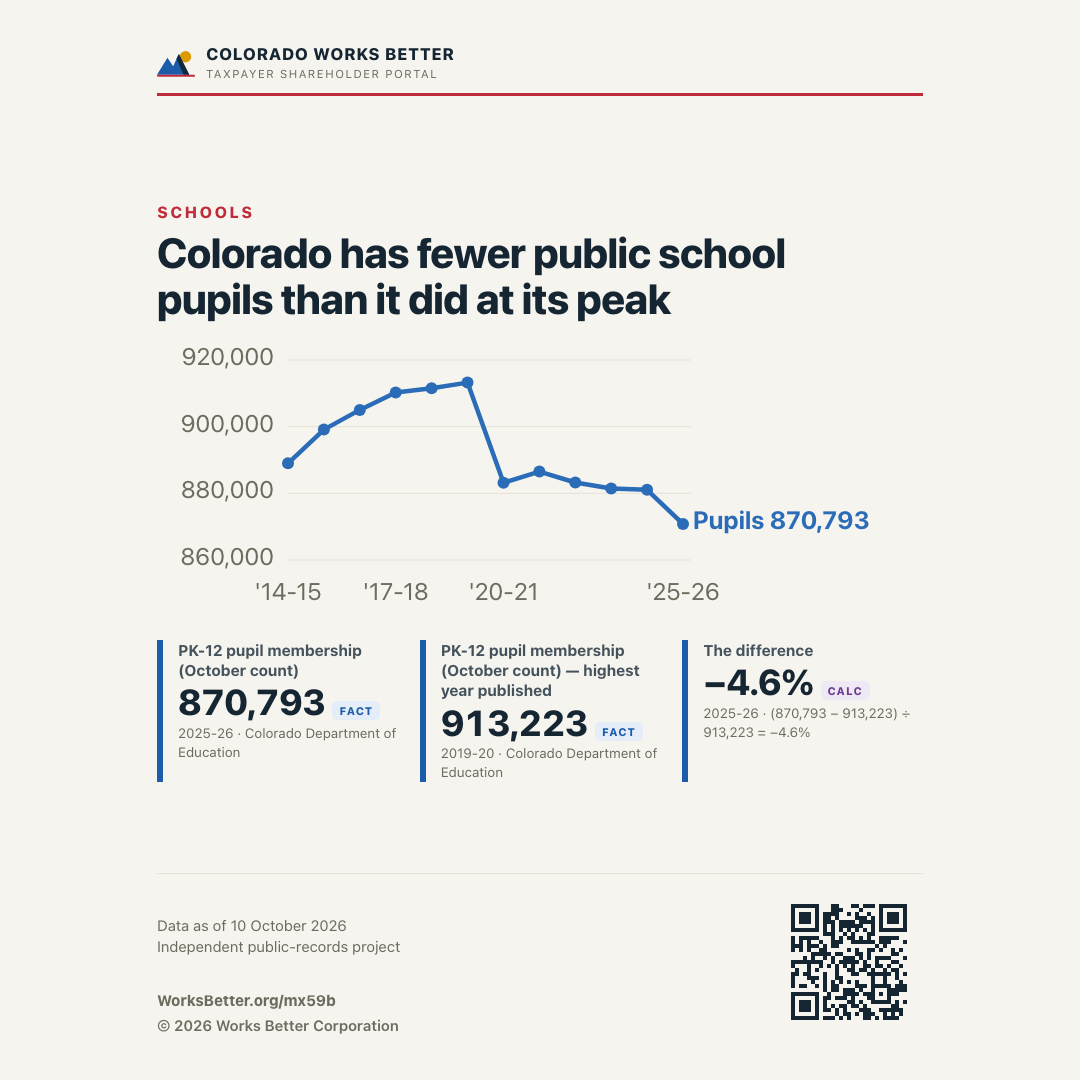
Public school enrollment fell 4.6%, from its peak of 913,223 in 2019-20 to 870,793 in 2025-26.
Every public school pupil, counted once each October — the state's own October count · 2014-15 to 2025-26
peak 913,223 (2019-20) · 2025-26: 870,793
Your post
Colorado has fewer public school pupils than it did at its peak. #ColoradoWorksBetter #TaxpayerShareholder #ShowYourWork
https://worksbetter.org/mx59b
Copy this address:
The charter share of public school enrollment rose 5.9 points, from 9.8% in 2011-12 to 15.7% in 2025-26. In 2023-24 eight online charter schools in one district were recoded as district-run schools, which moved more than 5,000 students out of the charter count.
Charter pupils as a share of all public school pupils, from the state's October count, 2011-12 to 2025-26. The 2023-24 drop is a recoding of eight online schools, not families leaving.
2023-24: Byers online schools recoded
Fully online enrollment rose 127.0%, from 15,249 in 2010-11 to 34,617 in 2025-26. The 2024-25 count adds online programs to online schools, and CDE does not say whether the earlier years included them.
Pupils in online schools and programs, from the state's October count, 2010-11 to 2025-26. The count adds online programs from 2024-25.
2024-25: count adds online programs
Reported home schooling rose 59.5%, from 6,501 in 2009-10 to 10,367 in 2025-26.
Students whose families filed a notice of intent to home-school with a district · 2009-10 to 2025-26 · a floor, not a total
View enrollment as a table — the last twelve Octobers
| Year | October count | Charter students | Charter share | Online students | Home-schooled (reported) |
|---|---|---|---|---|---|
| 2014-15 | 889,006 | 101,359 | 11.4% | 17,060 | 8,009 |
| 2015-16 | 899,112 | 108,793 | 12.1% | 18,665 | 8,606 |
| 2016-17 | 905,018 | 114,694 | 12.7% | 19,581 | 7,659 |
| 2017-18 | 910,280 | 120,739 | 13.3% | 19,876 | 7,387 |
| 2018-19 | 911,536 | 124,562 | 13.7% | 21,246 | 9,284 |
| 2019-20 | 913,223 | 126,947 | 13.9% | 22,488 | 7,880 |
| 2020-21 | 883,199 | 132,215 | 15% | 32,034 | 15,773 |
| 2021-22 | 886,517 | 135,241 | 15.3% | 31,382 | 10,502 |
| 2022-23 | 883,264 | 137,722 | 15.6% | 30,799 | 8,674 |
| 2023-24 | 881,464 | 135,223 | 15.3% | 31,839 | 9,406 |
| 2024-25 | 881,065 | 136,218 | 15.5% | 33,629 | 9,826 |
| 2025-26 | 870,793 | 136,627 | 15.7% | 34,617 | 10,367 |
| The charts above draw every year CDE prints for the charter, online and home-school series (15 years of charter share); this table shows the same twelve Octobers as the pupil chart. | |||||
| Two counts changed basis. In 2023-24 eight online charter schools in the Byers School District were recoded as district-run schools; CDE says the recoding moved more than 5,000 students from charter to non-charter counts (5,149 by its figure). The 2023-24 drop is that recoding, not families leaving charter schools. The 2024-25 count, 33,629, is online schools plus online programs (32,358 + 1,271). The comparison table that prints the earlier years counts the same Online pupils and prints 32,358 for fall 2024, the schools part alone; CDE does not say whether programs were in the counts before 2024-25. Read the rise into 2024-25 with that in mind. | |||||
| Home-schooled is a floor, not a total. It counts only students whose families filed the notice of intent to homeschool with a school district. No funding attaches to the count and nothing validates completeness, so the true number can only be higher. | |||||
Sources — Colorado Department of Education: 2025-26 State Level PK-12 Membership Workbook · 2024-25 State Level PK-12 Membership Workbook · 2024-25 100% Home Based Education Membership (district counts, fall 2009 through fall 2024) · Colorado Department of Education, School Quality and Support Division: State of Charter Schools Report 2026 · State of Charter Schools Report 2024-2025 · Colorado Department of Education, News Bureau: News Release — Colorado sees continued declines in preschool through 12th grade enrollment (fall 2025 October count) · Colorado Department of Education, Office of Online and Blended Learning: Online Enrollment Comparison by Year (OnlinePupilEnrollmentCountbyYear.xlsx, revised 5/19/2025) · 2024-25 Online Schools Data Snapshot
Colorado tests grades 3 through 8 every spring with CMAS, the state's own assessment. The federal government runs its own check, called NAEP, every two years. The two use different bars. They are never drawn on one axis. Graduation and attendance complete the picture. None of these figures implies a cause. Spending more, or less, is a different question from what came out.
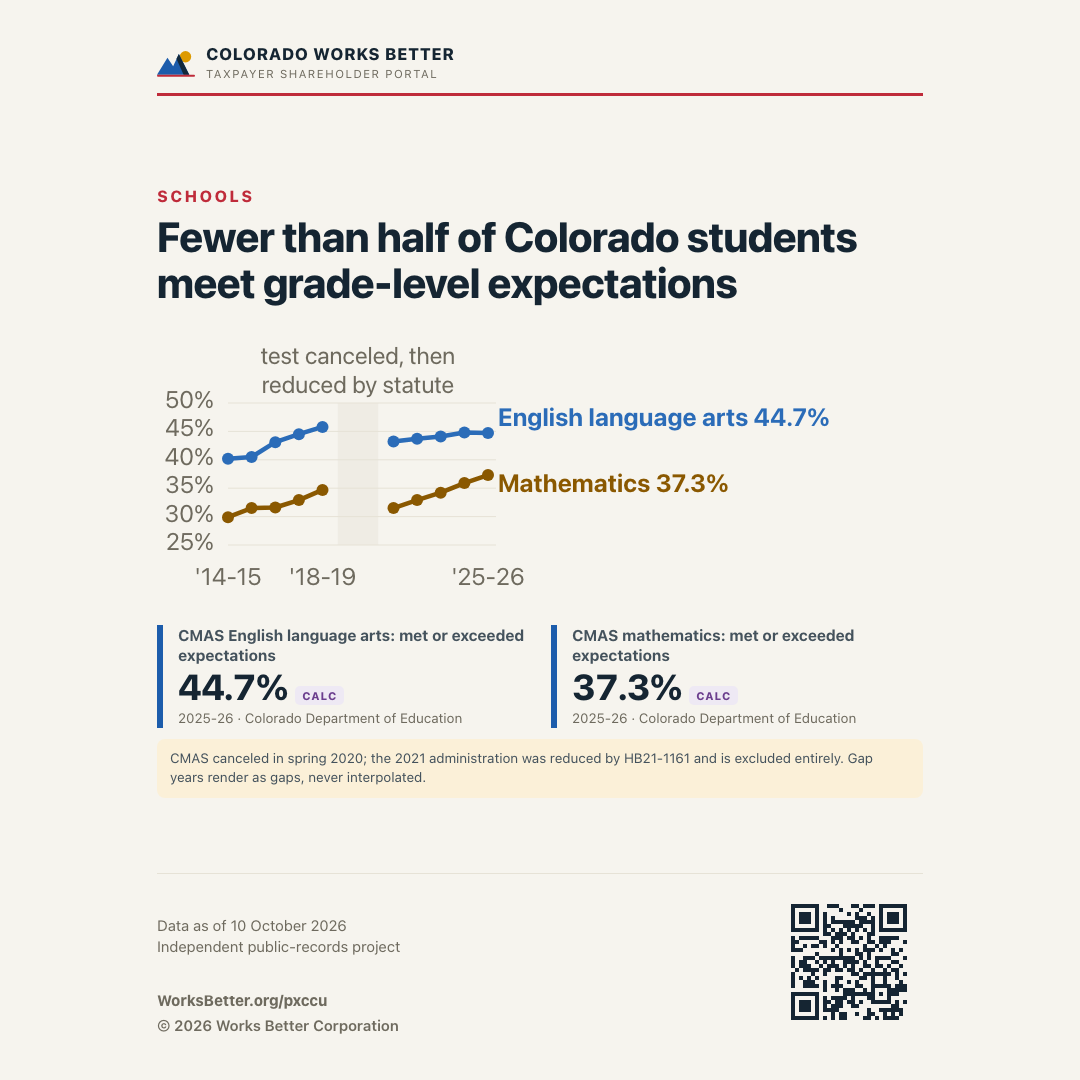
English language arts rose 4.5 points, from 40.2% in 2014-15 to 44.7% in 2025-26. Math rose 7.4 points, from 29.9% in 2014-15 to 37.3% in 2025-26. Two school years are blank: the 2020 tests were canceled and the 2021 tests were reduced by statute.
Grades 3-8, share of valid scores meeting or exceeding expectations · 2014-15 to 2025-26 · the two blank years render as gaps, never interpolated
2020 canceled · 2021 reduced by statute
There is no national CMAS figure, and none can exist: CMAS is Colorado's own test, and no other state sits it. Averaging other states' different tests would produce a number we made up. The measure that does compare states on one basis is NAEP — every state sits the same test. Its four cards are further down this section.
Your post
Fewer than half of Colorado students meet grade-level expectations. #ColoradoWorksBetter #TaxpayerShareholder #ShowYourWork
https://worksbetter.org/pxccu
Copy this address:
The 4-year graduation rate rose 10.6 points, from 75% in the class of 2012 to 85.6% in the class of 2025. In the class of 2022, the last year both publish, it was 4.3 points below the U.S. average, as in all 11 years both publish.
The 4-year adjusted cohort graduation rate, the federal definition on both sides · the class of 2012 to the class of 2025
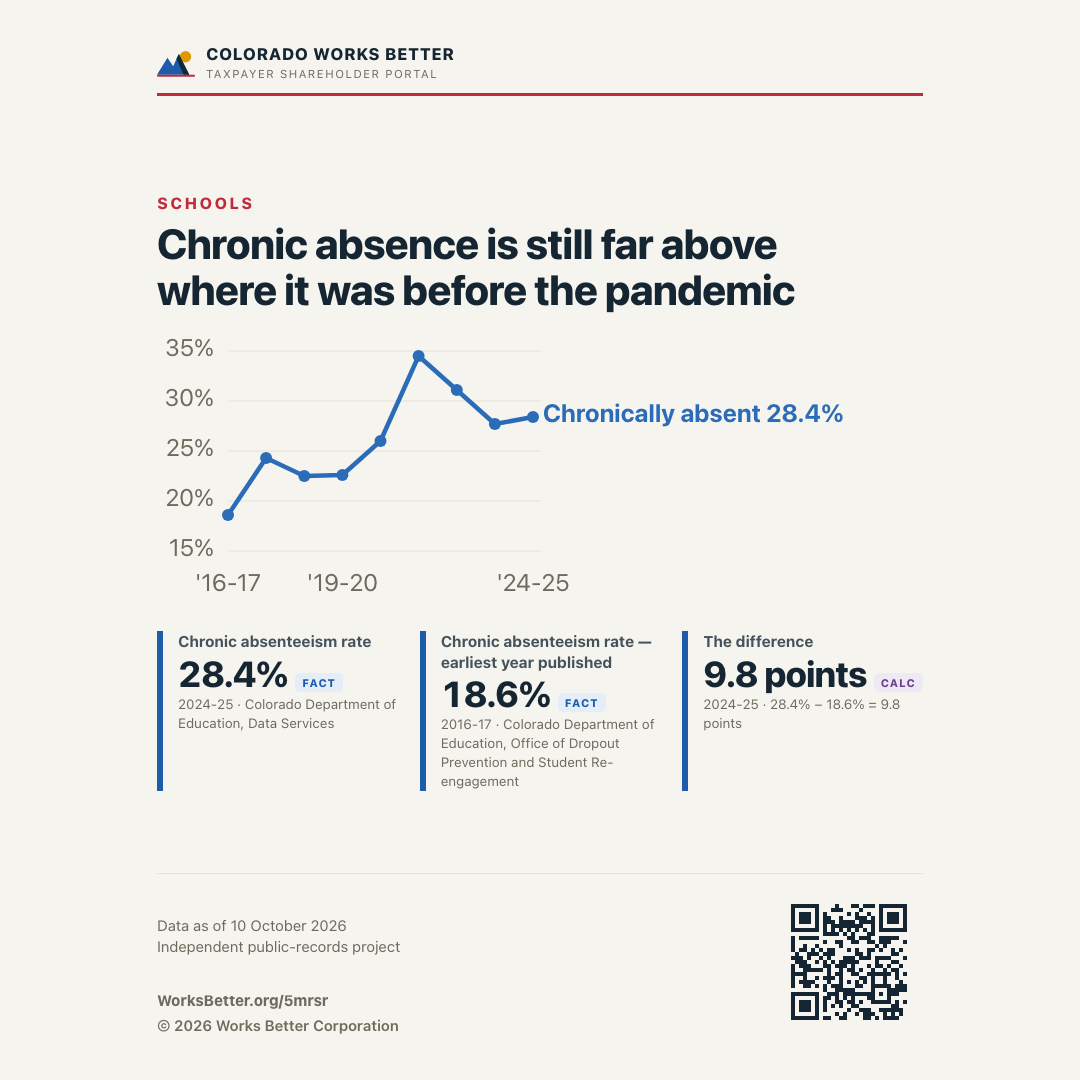
Chronic absence rose 9.8 points, from 18.6% in 2016-17 to 28.4% in 2024-25.
Students missing at least 10% of enrolled school days, excused and unexcused alike, the state's own count · 2016-17 to 2024-25
Your post
Chronic absence is still far above where it was before the pandemic. #ColoradoWorksBetter #TaxpayerShareholder #ShowYourWork
https://worksbetter.org/5mrsr
Copy this address:
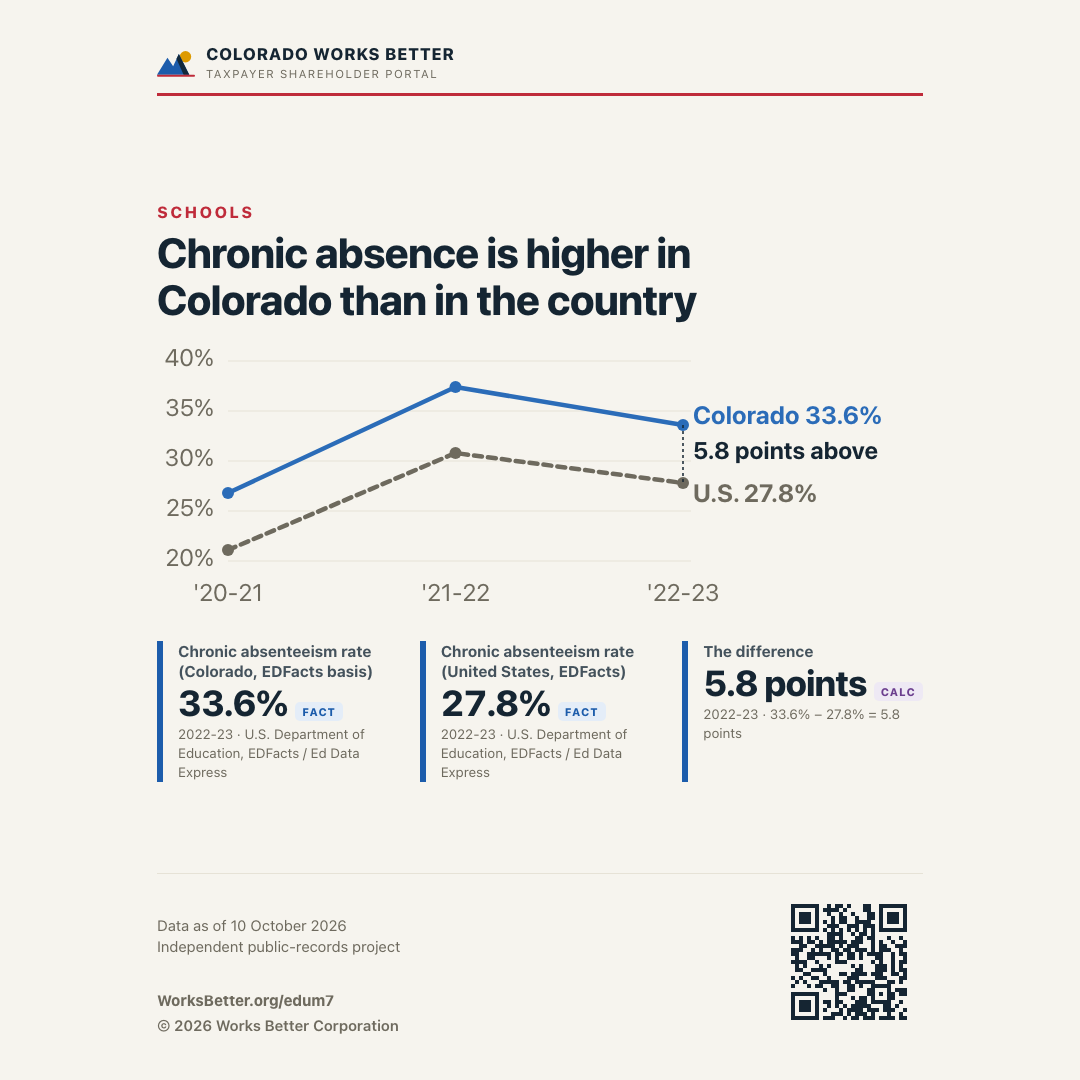
Chronic absence on the federal basis rose 6.8 points, from 26.8% in 2020-21 to 33.6% in 2022-23. It ends 5.8 points above the U.S. average.
The federal EDFacts basis, 2020-21 to 2022-23 — one file on both sides of the comparison
Colorado runs 5.8 points higher than the U.S. average.
Both lines come from one federal file. Neither is the figure above. The chart above is the state's own count. It runs nine school years. This one is the U.S. Department of Education's. It is the only place a national figure exists. The two disagree about Colorado. For 2022-23 the state says 31.1%. The federal file says 33.6%, a gap of 2.5 points. Both are official. We publish both rather than pick one. That is why the national line runs against the federal Colorado figure, not the state's. Mixing them would put two different counts on one axis. The gap would look smaller than it is. Three school years exist here, and the pandemic affected all three. That is the window the federal government publishes. We state it rather than stretch it. The definition is the same on both sides: a student absent 10 percent or more of the days they were enrolled.
Your post
Chronic absence is higher in Colorado than in the country. #ColoradoWorksBetter #TaxpayerShareholder #ShowYourWork
https://worksbetter.org/edum7
Copy this address:
The Nation's Report Card, public school students, 0-500 scale, 1998, 2022, 2024. A different bar from CMAS, never on a CMAS axis. Each dot is one year this page holds, with no line across the years between.
The Nation's Report Card, public school students, 0-500 scale, 2003, 2022, 2024. A different bar from CMAS, never on a CMAS axis. Each dot is one year this page holds, with no line across the years between.
The Nation's Report Card, public school students, 0-500 scale, 1998, 2022, 2024. A different bar from CMAS, never on a CMAS axis. Each dot is one year this page holds, with no line across the years between.
The Nation's Report Card, public school students, 0-500 scale, 2003, 2022, 2024. A different bar from CMAS, never on a CMAS axis. Each dot is one year this page holds, with no line across the years between.
View results as a table — every year of all eight series
| Year | CMAS ELA | CMAS math | 4-yr grad rate (CO) | 4-yr grad rate (US) | Chronic absenteeism (state count) | Absent students | Chronic absenteeism, federal (CO) | Chronic absenteeism, federal (US) |
|---|---|---|---|---|---|---|---|---|
| 2011-12 | 75% | 80% | ||||||
| 2012-13 | 76.9% | 81.4% | ||||||
| 2013-14 | 77.3% | 82.3% | ||||||
| 2014-15 | 40.2% | 29.9% | 77.3% | 83.2% | ||||
| 2015-16 | 40.5% | 31.5% | 78.9% | 84.1% | ||||
| 2016-17 | 43.1% | 31.6% | 79.1% | 84.6% | 18.6% | |||
| 2017-18 | 44.5% | 32.9% | 80.8% | 85.3% | 24.3% | |||
| 2018-19 | 45.8% | 34.7% | 81.1% | 85.8% | 22.5% | |||
| 2019-20 | 81.9% | 86.5% | 22.6% | |||||
| 2020-21 | 81.7% | 86.1% | 26% | 26.8% | 21.1% | |||
| 2021-22 | 43.2% | 31.5% | 82.3% | 86.6% | 34.5% | 297,906 | 37.4% | 30.8% |
| 2022-23 | 43.7% | 32.9% | 83.1% | 31.1% | 269,582 | 33.6% | 27.8% | |
| 2023-24 | 44.1% | 34.2% | 84.2% | 27.7% | 241,119 | |||
| 2024-25 | 44.8% | 35.9% | 85.6% | 28.4% | 244,622 | |||
| 2025-26 | 44.7% | 37.3% | ||||||
| The two blank CMAS years are deliberate. The spring 2020 tests were canceled; the spring 2021 tests ran on half the grades by statute (HB21-1161) and are excluded entirely. The chart renders both as gaps, never a bridge. | ||||||||
| The state and federal absence columns are two counts of one thing, and they disagree. Both are official and both are printed; they are never drawn on one axis. | ||||||||
View NAEP scores as a table — every year this page holds
| Year | Grade 4 reading (CO) | Grade 4 math (CO) | Grade 8 reading (CO) | Grade 8 math (CO) | Grade 4 reading (US) | Grade 4 math (US) | Grade 8 reading (US) | Grade 8 math (US) |
|---|---|---|---|---|---|---|---|---|
| 1998 | 220 | 264 | ||||||
| 2003 | 235 | 283 | ||||||
| 2022 | 223 | 236 | 263 | 275 | ||||
| 2024 | 221 | 239 | 265 | 278 | 214 | 237 | 257 | 272 |
| The years between are NAEP's, not missing. NAEP tested Colorado in other years as well; this page holds the years the 2024 state snapshots print as comparisons. No line is drawn across the years between. | ||||||||
Sources — Colorado Department of Education: CMAS Data and Results — state summary achievement files, 2015-2026 · 2024-2025 Graduation-Completion State Trends Workbook · National Center for Education Statistics: Digest of Education Statistics table 219.46 (ACGR by state, 2011-12 to 2021-22) · Colorado Department of Education, Data Services: 2024-2025 Attendance Rate, Truancy Rate and Chronic Absenteeism by State, Grade, IPST · 2023-2024 Attendance Rate, Truancy Rate and Chronic Absenteeism by State, Grade, IPST · 2022-2023 Attendance Rate, Truancy Rate and Chronic Absenteeism by State, Grade, IPST · Colorado Department of Education, Office of Dropout Prevention and Student Re-engagement: Summary of 2024-25 Attendance data · U.S. Department of Education, EDFacts / Ed Data Express: Chronic Absenteeism, school year 2020-21 — state-level percentage file (SY2021_DG814PCT_SEA_110324.csv) · Chronic Absenteeism, school year 2021-22 — state-level percentage file (SY2122_DG814PCT_SEA_110124.csv) · Chronic Absenteeism, school year 2022-23 — state-level percentage file (SY2223_DG814PCT_SEA_082724.csv) · National Center for Education Statistics (NAEP, the Nation’s Report Card): 2024 NAEP State Snapshot Reports — Colorado, grades 4 and 8, reading and mathematics
Two years are missing from the test series on purpose. The 2020 tests were canceled. The 2021 tests ran on half the grades by statute (HB21-1161), with participation as low as 58%. CDE's own 2022 file compares against 2019, not 2021. A gap is honest. A bridge over it would not be.
Chronic absenteeism means missing at least 10% of enrolled school days, excused and unexcused alike. It is not truancy, which the state counts separately.
Before a child reaches school age, the family buys care on a market. The state licenses that market, surveys it, and subsidizes it through three separate programs with three separate rules. The prices below are what the publishers state. The program facts are from the state's own annual reports.
Children served by CCCAP fell 8.4%, from 30,124 in FY 2023-24 to 27,598 in FY 2024-25. Before SFY 2023-24 the count left out Child Welfare cases, so the earlier years sit on a narrower basis and the line breaks there.
Children served by the Colorado Child Care Assistance Program, FY 2018-19 to FY 2024-25. The count changed basis in SFY 2023-24, when Child Welfare cases joined it. The line breaks there, and the rise into that year is not growth.
SFY 2023-24: Child Welfare cases join the count
View child care assistance as a table — every year of the series
| Fiscal year | Children served |
|---|---|
| FY 2018-19 | 29,546 |
| FY 2019-20 | 29,210 |
| FY 2020-21 | 24,055 |
| FY 2021-22 | 23,971 |
| FY 2022-23 | 25,864 |
| FY 2023-24 | 30,124 |
| FY 2024-25 | 27,598 |
| The count changed basis in SFY 2023-24. Starting in SFY 2023-24 the count includes Child Welfare CCCAP cases; earlier years count only low-income and TANF CCCAP, so the rise into 2023-24 is a basis change, not growth. Years before 2023-24 are on the narrower basis and must be drawn with this break marked. | |
View the 2022 Market Rate Study daily rates as a table
| Age band / setting | Daily rate (2022) |
|---|---|
| Center, 0-18 months | $75.28 |
| Center, 18-36 months | PENDING PENDING |
| Center, 36 months-6 years | PENDING PENDING |
| Center, school age | $39.67 |
| Family home, 0-24 months | $49.04 |
| Family home, 24 months-6 years | $46.04 |
| Family home, school age | $38.60 |
| Two cells are the study's own contradiction, held as PENDING rather than guessed. Center, 18-36 months: The study prints this cell twice and the printings disagree: $62.72 (executive summary "2022 Price") vs $65.59 (Table 9's named "2022 Survey Results" column, whose 2021 column is $62.72 — a transposed column). Held until a person decides which printing this site repeats; see MRS_CONTRADICTION. Center, 36 months-6 years: The study prints this cell twice and the printings disagree: $53.11 (executive summary "2022 Price") vs $58.03 (Table 9's named "2022 Survey Results" column, whose 2021 column is $53.11 — a transposed column). Held until a person decides which printing this site repeats; see MRS_CONTRADICTION. | |
| The market rate survey ended in 2022: federal rules let Colorado replace it with a cost model in October 2024, so no later market price exists to publish. | |
Sources — Child Care Aware of America: Child Care Affordability in Colorado — 2024-25 price fact sheet (from "Child Care in America: 2024 Price & Supply Report") · Dept. of Early Childhood (via data.colorado.gov): Colorado Licensed Child Care Facilities Report (a9rr-k8mu) · Colorado Department of Early Childhood: Colorado Universal Preschool Program Year 2024-25 Annual Report (January 2026) · CCCAP Annual Report FY 2024-25 (letter to the JBC, November 1, 2025, per C.R.S. § 26.5-4-114) · Brodsky Research and Consulting, for the Colorado Department of Human Services: 2022 Colorado Child Care Market Rate Study (June 2022)
The state's own price survey ended in 2022. Federal rules let Colorado replace its market rate survey with a cost model in October 2024. So the 2022 study is the last market price the state measured. Two of that study's seven statewide rates contradict the study's own table. Those two are held blank rather than guessed.
The national price figures above come from Child Care Aware of America, a nonprofit. They are labeled as theirs, because a nonprofit's survey is not a state statistic.
About half of Colorado's high school graduates now go straight to college. Before 2020 it was well over half. A rising share of those who go leave the state. Colorado's support per college student sits near the bottom of the states. That is part of why tuition carries the load. All of it is below, from the state's own statutory reports and the national association that measures state support.
The share going straight to college held: 50.5% in the class of 2020, 51% in the class of 2022.
High school graduates enrolled in college anywhere the fall after graduation · Class of 2020 to Class of 2022
The share of college-goers enrolling out of state rose 8.6 points, from 20.7% in the class of 2010 to 29.3% in the class of 2022.
Of the graduates who enrolled in college, the share who enrolled outside Colorado · the two classes this page holds, drawn as points
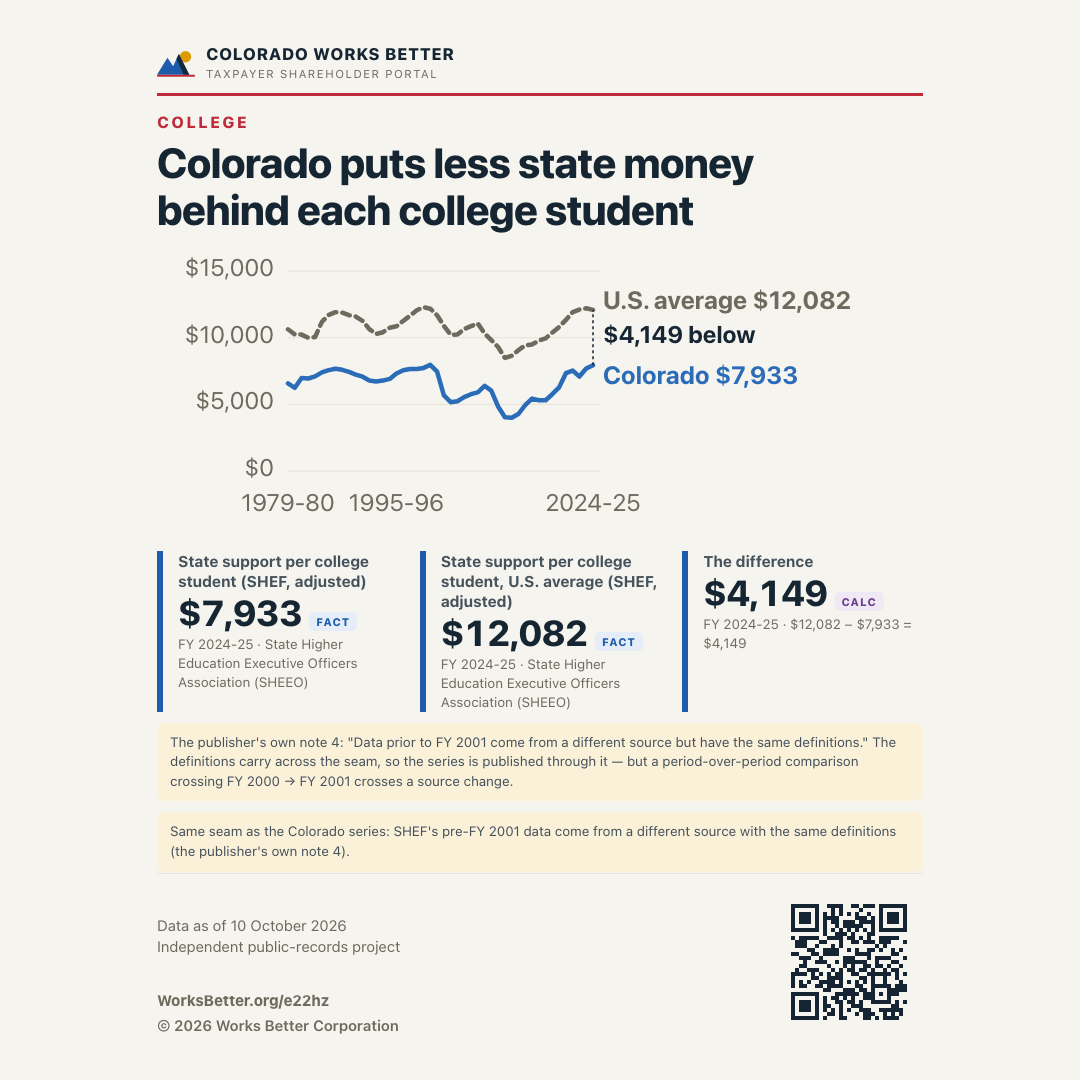
State support per full-time college student rose 20.8%, from $6,568 in FY 1979-80 to $7,933 in FY 2024-25. It ends $4,149 below the U.S. average, as in all 46 years both publish.
SHEF's adjusted basis (cost-of-living and enrollment-mix adjusted, constant dollars), Colorado against the U.S., FY 1979-80 to FY 2024-25
Colorado ends $4,149 below the U.S. average.
Your post
Colorado puts less state money behind each college student. #ColoradoWorksBetter #TaxpayerShareholder #ShowYourWork
https://worksbetter.org/e22hz
Copy this address:
Colorado's place among the 51 SHEF jurisdictions on state support per full-time student, FY 2010-11 to FY 2024-25. 1 is the highest and sits at the top.
CU Boulder resident tuition rose 26.4%, from $10,730 in 2018-19 to $13,566 in 2025-26. Mandatory fees fell $1,690 to $1,040 the same year, so the combined bill rose 4.3%.
Resident base tuition, University of Colorado Boulder · 2018-19 to 2025-26
Colorado State resident tuition rose 4.9%, from $13,780 in 2023-24 to $14,460 in 2025-26. The reports print the years before 2023-24 on an earlier basis, so the line breaks there.
Resident base tuition, thirty credit hours, Colorado State University · 2018-19 to 2025-26
2023-24: the reports change basis
Colorado School of Mines resident tuition rose 5.1%, from $21,870 in 2023-24 to $22,980 in 2025-26. The reports print the years before 2023-24 on an earlier basis, so the line breaks there.
Resident base tuition, thirty credit hours, Colorado School of Mines · 2018-19 to 2025-26
2023-24: the reports change basis
Debt at graduation among bachelor's completers who borrowed fell 9.5%, from $27,300 in 2013-14 to $24,700 in 2022-23.
Average debt at graduation among bachelor's completers who borrowed · 2013-14 to 2022-23
View state support as a table — every fiscal year of both series
| Fiscal year | Colorado $/FTE | U.S. $/FTE | Colorado rank |
|---|---|---|---|
| FY 1979-80 | $6,568 | $10,624 | |
| FY 1980-81 | $6,241 | $10,247 | |
| FY 1981-82 | $6,984 | $10,231 | |
| FY 1982-83 | $6,941 | $9,993 | |
| FY 1983-84 | $7,094 | $10,047 | |
| FY 1984-85 | $7,395 | $11,190 | |
| FY 1985-86 | $7,567 | $11,702 | |
| FY 1986-87 | $7,667 | $11,907 | |
| FY 1987-88 | $7,592 | $11,876 | |
| FY 1988-89 | $7,436 | $11,685 | |
| FY 1989-90 | $7,228 | $11,583 | |
| FY 1990-91 | $7,071 | $11,261 | |
| FY 1991-92 | $6,789 | $10,639 | |
| FY 1992-93 | $6,719 | $10,273 | |
| FY 1993-94 | $6,781 | $10,412 | |
| FY 1994-95 | $6,907 | $10,743 | |
| FY 1995-96 | $7,310 | $10,856 | |
| FY 1996-97 | $7,556 | $11,256 | |
| FY 1997-98 | $7,649 | $11,645 | |
| FY 1998-99 | $7,655 | $12,062 | |
| FY 1999-00 | $7,729 | $12,287 | |
| FY 2000-01 | $7,955 | $12,169 | |
| FY 2001-02 | $7,445 | $11,675 | |
| FY 2002-03 | $5,668 | $10,893 | |
| FY 2003-04 | $5,160 | $10,207 | |
| FY 2004-05 | $5,236 | $10,229 | |
| FY 2005-06 | $5,545 | $10,653 | |
| FY 2006-07 | $5,762 | $10,858 | |
| FY 2007-08 | $5,899 | $11,062 | |
| FY 2008-09 | $6,384 | $10,319 | |
| FY 2009-10 | $6,022 | $9,816 | |
| FY 2010-11 | $4,837 | $9,297 | 49 of 51 |
| FY 2011-12 | $4,036 | $8,480 | 49 of 51 |
| FY 2012-13 | $3,995 | $8,642 | 49 of 51 |
| FY 2013-14 | $4,276 | $9,060 | 49 of 51 |
| FY 2014-15 | $4,942 | $9,423 | 49 of 51 |
| FY 2015-16 | $5,430 | $9,486 | 49 of 51 |
| FY 2016-17 | $5,300 | $9,770 | 49 of 51 |
| FY 2017-18 | $5,312 | $9,947 | 49 of 51 |
| FY 2018-19 | $5,757 | $10,378 | 49 of 51 |
| FY 2019-20 | $6,272 | $10,801 | 48 of 51 |
| FY 2020-21 | $7,336 | $11,330 | 48 of 51 |
| FY 2021-22 | $7,527 | $11,918 | 47 of 51 |
| FY 2022-23 | $7,088 | $12,106 | 49 of 51 |
| FY 2023-24 | $7,687 | $12,205 | 42 of 51 |
| FY 2024-25 | $7,933 | $12,082 | 42 of 51 |
| The rank column is blank before FY 2010-11, on purpose. The series starts in FY 2010-11 because D.C. enters SHEF's data then; a rank over the earlier 50-member pool would be a different measure under the same name. | |||
| SHEF's own adjusted basis: education appropriations ÷ (COLI × EMI × HECA) ÷ net FTE enrollment, rounded to whole dollars — the publisher's cost-of-living and enrollment-mix adjustments, in constant FY 2025 dollars via SHEEO's own HECA inflation index (never CPI on top of it; the file's note 5 forbids applying both). | |||
View college going, tuition and debt as a table — every year this page holds
| Year | Went straight to college | Of those, left Colorado | CU Boulder tuition | Colorado State tuition | Mines tuition | Bachelor's debt (borrowers) | Share who borrowed |
|---|---|---|---|---|---|---|---|
| 2010 | 20.7% | ||||||
| 2014 | $27,300 | 63.5% | |||||
| 2015 | $26,600 | 62% | |||||
| 2016 | $26,500 | 60.3% | |||||
| 2017 | $26,700 | 58.7% | |||||
| 2018 | $25,700 | 55.6% | |||||
| 2019 | $10,730 | $9,426 | $16,650 | $25,700 | 55.4% | ||
| 2020 | 50.5% | $10,728 | $9,426 | $16,650 | $25,700 | 54.7% | |
| 2021 | 49.9% | $10,728 | $9,426 | $16,650 | $25,300 | 52.9% | |
| 2022 | 51% | 29.3% | $11,040 | $9,709 | $17,160 | $25,200 | 50% |
| 2023 | $11,520 | $9,903 | $24,700 | 47.9% | |||
| 2024 | $11,976 | $13,780 | $21,870 | ||||
| 2025 | $12,312 | $14,089 | $22,410 | ||||
| 2026 | $13,566 | $14,460 | $22,980 | ||||
| The out-of-state share is published here for two classes only, twelve years apart; the chart draws them as two points and no line between. | |||||||
| Colorado State and Mines change basis at 2023-24. The FY2025 report restated 2023-24 about $3,500 higher. Read that step as a change of basis, not a price rise. The Mines figure for 2022-23 is blank on purpose: the 2023 report prints $20,640 and the 2024 report $17,520 for that year, and neither is followed. | |||||||
View the COF stipend and flagship tuitions as a table
| Measure | Amount | Unit | Year |
|---|---|---|---|
| College Opportunity Fund stipend, public colleges | $116 | per credit hour | 2026-27 |
| College Opportunity Fund stipend, participating private colleges | $58 | per credit hour | 2026-27 |
| Resident tuition, University of Colorado - Boulder | $13,566 | per academic year | 2025-26 |
| Resident tuition, Colorado State University | $14,460 | per academic year | 2025-26 |
| Resident tuition, Colorado School of Mines | $22,980 | per academic year | 2025-26 |
| CU Boulder's 2025-26 jump is mostly a fee realignment, not a price rise of the same size. Mandatory fees fell $1,690 to $1,040 in the same year under Long Bill Footnote 29: "except that mandatory student fees up to a total of $794 for 30 credit hours at the University of Colorado Boulder may be incorporated into resident tuition rates, with no resulting effective combined tuition and mandatory fee increase to any student, and any incorporated fees shall never be reestablished as a student fee." The report's own combined comparison is +4.3% against +10.2% for base tuition alone. | |||
| The private-college COF stipend is half the public rate, as the State's own page prints it — asserted on every build, never assumed. | |||
What U.S. News published about Colorado universities
Best Colleges 2026, National Universities · a ranking is a fact about its publisher
A ranking is a fact about its publisher. These say what U.S. News published, under a method U.S. News chose, and they measure no university directly. Every Colorado rank in this edition is a tie. U.S. News ranks other Colorado schools on two other lists, and a rank on one list cannot be set beside a rank on another, so only this list is shown.
View what U.S. News published about Colorado universities
| University | Rank in National Universities |
|---|---|
| Colorado School of Mines | 80 (tie) |
| University of Colorado Boulder | 97 (tie) |
| University of Denver | 117 (tie) |
| Colorado State University | 151 (tie) |
| This is a fact about U.S. News, not a measurement of any university. It says where one magazine placed each school under a method it chose. | |
| Only one of the three lists is shown. U.S. News also ranks Colorado schools on National Liberal Arts Colleges and on Regional Colleges West. A rank on one list says nothing about a rank on another, so putting them in one table would invite a comparison that does not hold. | |
| The pages refuse automated readers and render their ranks in the browser, so these were read by a person. The read date is on every figure. Nothing here can be re-checked automatically. | |
Sources — Colorado Department of Higher Education: Postsecondary Access and Success for Colorado’s High School Graduates — 2026 Key Findings · 2025 Higher Education Return on Investment Report · State Higher Education Executive Officers Association (SHEEO): State Higher Education Finance (SHEF), FY 2025 — Report Data workbook, state × fiscal year 1980-2025 · Colorado Department of Higher Education, Finance Division: Tuition and Fees Report — Tuition and Fees for the 2025-2026 Academic Year · Tuition and Fees Report FY 2020 — resident undergraduate base tuition and fees, 2018-19 and 2019-20 · Tuition and Fees Report FY 2021 — resident undergraduate base tuition and fees, 2019-20 and 2020-21 · Tuition and Fees Report FY 2022 — resident undergraduate base tuition and fees, 2020-21 and 2021-22 · Tuition and Fees Report FY 2023 — resident undergraduate base tuition and fees, 2021-22 and 2022-23 · Tuition and Fees Report FY 2024 — resident undergraduate base tuition and fees, 2022-23 and 2023-24 · Tuition and Fees Report FY 2025 — resident undergraduate base tuition and fees, 2023-24 and 2024-25 · U.S. News & World Report: 2026 Best Colleges — Colorado · College Assist, for the Colorado Department of Higher Education: College Opportunity Fund — stipend amount
What a university ranking would add, and why it is not here yet. Magazine rankings are an editorial product. They are real as a fact about the publisher, not about the university, and their methods change year to year. If they appear here later, they will be quoted as the publisher's own claim. The federal outcome figures beside them need no editor. FTE means full-time-equivalent student, the standard unit for comparing support across states.
Sources, definitions, and what we refuse to do
Where a chart draws no U.S. line, this page holds no national figure on the same basis. Total Program and the per-pupil formula amount are Colorado's own formula, and CMAS is its own test. The October counts, home schooling, child care assistance, college going and leaving, tuition at three named universities and bachelor's debt are Colorado collections. The SHEF rank already places Colorado among the states.
Where a same-basis national figure exists, the chart draws it as a dashed gray line. It is labeled as the national figure and never added to Colorado's.
Every figure on this page is re-read from its publisher by code. Each is reconciled against something the publisher states independently, and checked against this page on every build. The full record for any figure — its source, date, formula and caveats — is one click away on Ask WB (opens in a new tab).
The refusals on this page, in one place. No private school trend — the collection is voluntary and unvalidated, and the state's own caveat is quoted above. No 2021 test score (half the grades, by statute). No bridge across the 2020 gap. No university rankings without attribution to their editor. No cause-and-effect claim anywhere. This page shows money and results side by side, and stops.
The home-school figure is a floor. It counts only families who file a notice with a district. No funding attaches to it, and nothing validates it. So the true number can only be higher. The page says "reported" wherever it appears.
Full data standards: Methodology · The Honesty Framework (opens in a new tab) · Cost of living for the same households: Follow Your Dollar