Schools
Fewer than half of Colorado students meet grade-level expectations
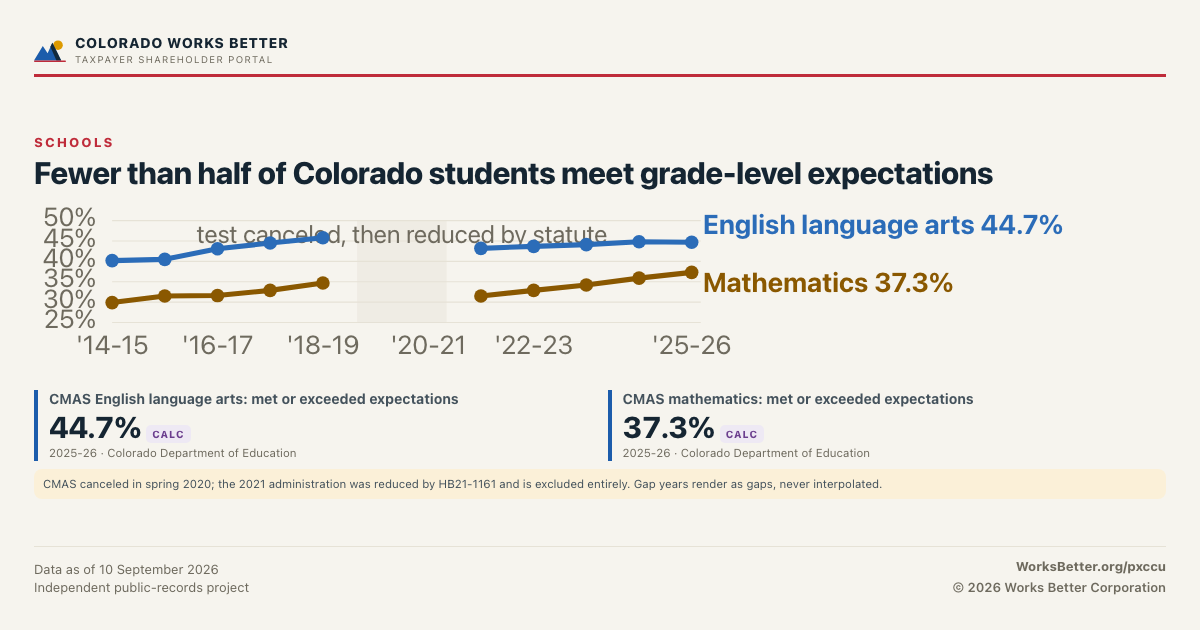
CMAS is the state test, taken in the middle grades. These are the shares of students who met or exceeded expectations in English language arts and in mathematics, on the state's own scoring.
CMAS English language arts: met or exceeded expectations
44.7% CALC
2025-26 · Colorado Department of Education
Valid-score-weighted mean over grades 3-8 of the per-grade percent met or exceeded in CDE's 2026 state summary ("2026CMASMathELACSLAStateSummaryAchievementResults.xlsx"): grade 3 40.8% of 54,154, grade 4 47% of 56,808, grade 5 49.9% of 55,942, grade 6 41.6% of 54,941, grade 7 46.6% of 52,766, grade 8 42.2% of 49,977; 324,588 valid scores in all. No CDE file prints this aggregate — the per-grade figures are the publisher's, the weighting is ours. Participation by grade ran 80.4%-93.7%; the participation figure on this row is the floor. English-language administration only; CSLA (Spanish language arts) is a different test and is excluded.
CMAS mathematics: met or exceeded expectations
37.3% CALC
2025-26 · Colorado Department of Education
Valid-score-weighted mean over grades 3-8 of the per-grade percent met or exceeded in CDE's 2026 state summary ("2026CMASMathELACSLAStateSummaryAchievementResults.xlsx"): grade 3 41.5% of 55,928, grade 4 39% of 58,268, grade 5 39.3% of 55,955, grade 6 32.7% of 55,081, grade 7 32.9% of 52,864, grade 8 37.8% of 50,110; 328,206 valid scores in all. No CDE file prints this aggregate — the per-grade figures are the publisher's, the weighting is ours. Participation by grade ran 80.5%-93.9%; the participation figure on this row is the floor.
The measure changed part-way through this series. CMAS canceled in spring 2020; the 2021 administration was reduced by HB21-1161 and is excluded entirely. Gap years render as gaps, never interpolated.
Where these figures come from
- Colorado Department of Education — CMAS Data and Results — state summary achievement files, 2015-2026 (opens in a new tab)
Data as of 10 September 2026. Every figure here is read from the checked Colorado dataset when this page is built, so a correction to the data corrects this page. Nothing on it was typed by hand.
The image this link carries
Shared anywhere that shows a preview, this link brings the card below with it.