COLORADO WORKS BETTER™ Taxpayer Shareholder Portal Follow

Who runs this

Works Better Corporation, a nonpartisan public benefit corporation, builds this site.

Independent public-records project, separate from the State of Colorado and from every party and campaign.

Every number carries one of four labels (FACT, CALC, SAMPLE or PENDING) and a source you can open.

Colorado’s marijuana money, year by year

In the Weeds

Pick a year. Four cards show how the money moved from the year before, and how far the plan was from what the state’s payment ledger shows paid.

FY 2025-26: July 2025 to June 2026

CALC
Show me the source
  • Colorado Department of Revenue, Marijuana Tax Reports, state workbook published October 2026: revenue months July 2025 to June 2026 (12 of 12). A revenue month carries the sales of the month before.
  • Share = a destination’s dollars ÷ all distributed dollars that year (CALC).
CALC
Show me the source
CALC
Show me the source
  • JBC Staff, Appropriations Report FY 2026-27, table “Summary of Appropriations and Transfers from the Marijuana Tax Cash Fund”, first column, the year as amended, PDF pp. 181-182.
  • Share = a use’s dollars ÷ the final plan (CALC).
CALC
Show me the source

Carry. What the year left in the fund at its close: PENDING

The one actual balance read is this year’s beginning balance: $108.1M on 1 July 2025 FACT

Six findings

What the record shows

Findings 1, 2, 3, 5 and 6 rest on the fund’s plans and payments, which this page reads for FY 2019-20 to FY 2025-26. Finding 4 rests on the Department of Revenue’s monthly reports, which start in February 2014, so it runs from the first full fiscal year.

CALC

Finding 1 · Planned vs paid

−41.9% to −24.6%

TOPS shows less paid than the final plan in every year, by these margins.

FY 2021-22 had the widest gap, −$63.3M; FY 2020-21 the narrowest, −$30.0M. A gap is not money left unpaid: TOPS lists about three quarters of state spending.

Source: final plan, JBC Staff Appropriations Reports FY 2020-21 to FY 2026-27, Marijuana Tax Cash Fund table, first column FACT. Paid: TOPS, the state’s payment ledger, every line charged to the fund, journal months July 2019 to June 2026.

CALC

Finding 2 · Plans moved

$99.7M

Planned at enactment, then taken out of that year’s plan by the next session, in 3 years.

FY 2021-22 $49.8M; FY 2022-23 $29.9M; FY 2023-24 $20.0M. Most of it is transfers to school construction FACT. FY 2021-22: enacted $100.0M, final $50.0M. FY 2022-23: enacted $30.0M, final $0. FY 2023-24: enacted $20.0M, final $0.

Source: JBC Staff Appropriations Reports FY 2020-21 to FY 2026-27, Marijuana Tax Cash Fund table. The plan at enactment is its second column; the final plan is its first.

FACT

Finding 3 · One year, to operations

$137.0M

Moved from the fund to the General Fund in FY 2020-21 (H.B. 20-1401).

The same year, $80.3M of excise tax meant for school construction went to the State Public School Fund, which pays school operating costs (H.B. 20-1418) CALC. No other final plan from FY 2019-20 to FY 2025-26 moved fund money to the General Fund. One $0.5M cut in FY 2025-26 has two destinations in two Joint Budget Committee documents.

Source: transfer lines, JBC Staff, Appropriations Report FY 2021-22, first column. Excise: DOR revenue months July 2020 to June 2021. Purpose: JBC Staff Budget Briefing FY 2026-27, Marijuana Policy Overview, p. 8.

CALC

Finding 4 · Toward the fund

56.6% → 54.6%

The fund’s share of every marijuana dollar, FY 2014-15 to FY 2025-26.

Over the whole record the fund’s share is lower than in the first full year. It fell to 46.2% in FY 2020-21 and has risen since. The local governments’ share moved to the fund: 6.1% in FY 2014-15, 3.2% in FY 2025-26, and none from 1 July 2026. The General Fund received none of it through FY 2016-17, 3.8% in FY 2017-18, and 9.3% to 10.7% in every year since CALC.

Source: Colorado Department of Revenue, Marijuana Tax Reports, state workbook, revenue months July 2014 to June 2026. Share = a destination’s dollars ÷ all distributed dollars that year.

CALC

Finding 5 · Overhead

3.7% → 5.7%

Share of the fund’s appropriations in its own overhead lines.

Lines the table names “centrally appropriated amounts” and “indirect cost assessments”: $5.8M in FY 2019-20 to $8.9M in FY 2023-24. Later editions print departments only.

Source: JBC Staff Appropriations Reports FY 2020-21 to FY 2026-27, Marijuana Tax Cash Fund table, program lines, first column FACT. Share = overhead lines ÷ appropriations.

FACT

Finding 6 · A shrinking fund

$155.9M → $124.7M

Final appropriations, FY 2019-20 to FY 2025-26.

Marijuana collections peaked in FY 2020-21 at $437.1M distributed CALC and have fallen since. FY 2026-27 is planned at $123.6M at enactment.

Source: JBC Staff Appropriations Reports FY 2020-21 to FY 2026-27, Marijuana Tax Cash Fund table, first column. Collections: DOR Marijuana Tax Reports, revenue months July to June.
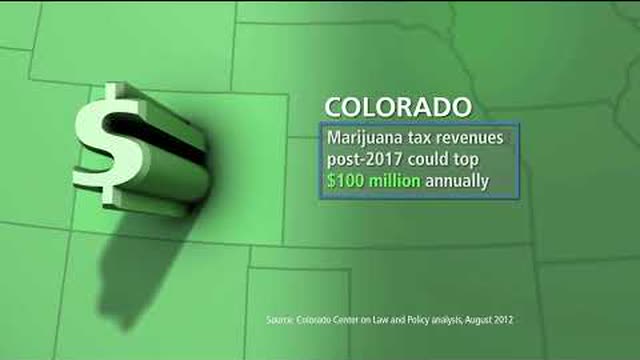

Exhibit 1 · FY 2013-14 to FY 2026-27

Where the money went

CALC

Every marijuana tax and fee dollar Colorado collected, from the first month of retail sales to the latest month reported. That is revenue months February 2014 to August 2026, $3.26B in all. Line width is dollars, not adjusted for inflation.

Where Colorado’s marijuana tax and fee dollars went, FY 2013-14 to FY 2026-27Marijuana Tax Cash Fund $1.64B; School construction (BEST) $612.3M; State Public School Fund $309.2M; General Fund $259.8M; Local governments $214.1M; Marijuana Cash Fund $159.1M; Public School Fund (permanent) $67.6M. Every figure is CALC, the sum of DOR’s 151 revenue months.Retail sales tax (10%, then 15%) to Marijuana Tax Cash Fund: $1.45B (CALC)State sales tax (2.9%) to Marijuana Tax Cash Fund: $188.8M (CALC)Excise tax (15%) to School construction (BEST): $612.3M (CALC)Retail sales tax (10%, then 15%) to State Public School Fund: $228.9M (CALC)Excise tax (15%) to State Public School Fund: $80.3M (CALC)Retail sales tax (10%, then 15%) to General Fund: $259.8M (CALC)Retail sales tax (10%, then 15%) to Local governments: $214.1M (CALC)Retail sales tax (10%, then 15%) to Marijuana Cash Fund: $2.8M (CALC)License and other fees to Marijuana Cash Fund: $156.3M (CALC)Excise tax (15%) to Public School Fund (permanent): $67.6M (CALC)Retail sales tax (10%, then 15%)$2.16BExcise tax (15%)$761.2MState sales tax (2.9%)$188.8MLicense and other fees$156.3MMarijuana Tax Cash Fund$1.64B · 50.2%School construction (BEST)$612.3M · 18.8%State Public School Fund$309.2M · 9.5%General Fund$259.8M · 8.0%Local governments$214.1M · 6.6%Marijuana Cash Fund$159.1M · 4.9%Public School Fund (permanent)$67.6M · 2.1%
Where Colorado’s marijuana tax and fee dollars went, FY 2013-14 to FY 2026-27Marijuana Tax Cash Fund $1.64B; School construction (BEST) $612.3M; State Public School Fund $309.2M; General Fund $259.8M; Local governments $214.1M; Marijuana Cash Fund $159.1M; Public School Fund (permanent) $67.6M. Every figure is CALC, the sum of DOR’s 151 revenue months.Retail sales tax (10%, then 15%) to Marijuana Tax Cash Fund: $1.45B (CALC)State sales tax (2.9%) to Marijuana Tax Cash Fund: $188.8M (CALC)Excise tax (15%) to School construction (BEST): $612.3M (CALC)Retail sales tax (10%, then 15%) to State Public School Fund: $228.9M (CALC)Excise tax (15%) to State Public School Fund: $80.3M (CALC)Retail sales tax (10%, then 15%) to General Fund: $259.8M (CALC)Retail sales tax (10%, then 15%) to Local governments: $214.1M (CALC)Retail sales tax (10%, then 15%) to Marijuana Cash Fund: $2.8M (CALC)License and other fees to Marijuana Cash Fund: $156.3M (CALC)Excise tax (15%) to Public School Fund (permanent): $67.6M (CALC)Retail sales tax (10%, then 15%)$2.16BExcise tax (15%)$761.2MState sales tax (2.9%)$188.8MLicense and other fees$156.3MMarijuana TaxCash Fund$1.64B · 50.2%School construction(BEST)$612.3M · 18.8%State PublicSchool Fund$309.2M · 9.5%General Fund$259.8M · 8.0%Local governments$214.1M · 6.6%Marijuana Cash Fund$159.1M · 4.9%Public SchoolFund (permanent)$67.6M · 2.1%
Every flow is CALC: the sum of DOR’s 151 revenue months, FY 2013-14 (from February 2014) to FY 2026-27 (through August 2026). Each month’s split is DOR’s own column, so the bands carry every change in the law over the span. DOR’s distribution columns do not sum exactly to its tax columns: for the retail sales tax (10%, then 15%) they are $1.0M less, and for the excise tax (15%) they are $0.9M less, which DOR’s footnote counts as collections not yet allocated. Each band is drawn at its distribution column, so the destinations sum to $3.26B. In FY 2020-21 alone, excise tax went to the State Public School Fund instead of the permanent Public School Fund (H.B. 20-1418); the bands show it where it went.

Source: Colorado Department of Revenue, Marijuana Tax Reports, state workbook published October 2026: revenue months February 2014 to August 2026. A revenue month carries the sales of the month before.

Show the destinations as a table
FY 2013-14 to FY 2026-27: where every marijuana tax and fee dollar went
DestinationDollarsCALCShareCALC
Marijuana Tax Cash Fund$1.64B50.2%
School construction (BEST)$612.3M18.8%
State Public School Fund$309.2M9.5%
General Fund$259.8M8.0%
Local governments$214.1M6.6%
Marijuana Cash Fund$159.1M4.9%
Public School Fund (permanent)$67.6M2.1%
All distributed$3.26B100.0%

Exhibit 2 · FY 2013-14 to FY 2026-27

How the split changed, year by year

CALC

The share of each fiscal year’s marijuana dollars that reached each destination, July to June. Has money moved toward the Marijuana Tax Cash Fund, and has more of it gone to the General Fund?

Marijuana Tax Cash FundSchool construction (BEST)State Public School FundGeneral FundLocal governmentsMarijuana Cash FundPublic School Fund (permanent)
  1. 13-14*64%13%17%$23.6M
  2. 14-1557%23%14%$102.1M
  3. 15-1657%26%10%$156.7M
  4. 16-1756%18%14%$223.5M
  5. 17-1848%15%11%11%$263.6M
  6. 18-1949%19%11%$274.0M
  7. 19-2048%24%10%$330.9M
  8. 20-2146%9%26%9%$437.1M
  9. 21-2247%26%9%$378.6M
  10. 22-2351%19%10%$292.7M
  11. 23-2450%19%10%$261.6M
  12. 24-2551%17%11%$246.1M
  13. 25-2655%17%11%$231.5M
  14. 26-27*55%19%11%$38.3M
Each bar is one fiscal year of DOR revenue months; each share is a destination’s dollars ÷ all distributed dollars that year CALC. The figure at the right is all distributed dollars. *A part year, drawn with a dashed outline: FY 2013-14 is February 2014 to June 2014, 5 of 12 months; FY 2026-27 is July 2026 to August 2026, 2 of 12 months. Its shares are its own months only, and its total is not a year’s.

Source: Colorado Department of Revenue, Marijuana Tax Reports, state workbook published October 2026: revenue months February 2014 to August 2026. A revenue month carries the sales of the month before.

Show the shares as a table
Each fiscal year’s marijuana tax and fee dollars, the share to each destination
Fiscal yearDistributedCALCMarijuana Tax Cash FundSchool construction (BEST)State Public School FundGeneral FundLocal governmentsMarijuana Cash FundPublic School Fund (permanent)
FY 2013-14 (5 months)$23.6M64.3%12.8%——5.7%17.2%—
FY 2014-15$102.1M56.6%23.4%——6.1%13.9%—
FY 2015-16$156.7M56.6%25.5%——6.4%9.8%1.6%
FY 2016-17$223.5M55.5%17.9%——6.6%5.8%14.1%
FY 2017-18$263.6M47.7%15.2%11.4%3.8%6.5%4.9%10.5%
FY 2018-19$274.0M49.4%19.2%7.3%10.5%7.1%4.3%2.1%
FY 2019-20$330.9M47.8%24.4%7.7%9.6%6.8%3.6%—
FY 2020-21$437.1M46.2%9.2%25.9%9.3%6.6%2.8%—
FY 2021-22$378.6M47.0%25.7%7.7%9.5%6.8%3.4%—
FY 2022-23$292.7M50.8%19.0%8.5%10.5%7.5%3.8%—
FY 2023-24$261.6M50.2%18.8%8.4%10.4%7.4%4.7%—
FY 2024-25$246.1M50.9%17.2%8.6%10.6%7.6%5.2%—
FY 2025-26$231.5M54.6%17.4%8.6%10.7%3.2%5.6%—
FY 2026-27 (2 months)$38.3M55.4%19.0%8.5%10.5%1.3%5.2%—

The Marijuana Tax Cash Fund · FY 2014-15 to FY 2025-26

Each year’s final plan, sent where

FACT

What the legislature’s final plan for each fiscal year sent out of the fund. It holds money for department programs, the fund’s own overhead lines, and transfers to other funds. Bar length is dollars.

Department programsOverhead linesTransfers to the General FundTransfers to school construction (BEST)Transfers to school operating fundsOther transfers, net
  1. 14-15PENDING
  2. 15-16PENDING
  3. 16-17PENDING
  4. 17-18PENDING
  5. 18-19PENDING
  6. 19-20$150.2M$159.2M
  7. 20-21$115.5M$137.0M$266.2M
  8. 21-22$143.5M$50.0M$206.5M
  9. 22-23$150.1M$158.9M
  10. 23-24$146.7M$156.2M
  11. 24-25$143.7M$145.3M
  12. 25-26$124.7M$128.6M
Each line is the Joint Budget Committee staff table’s own figure FACT, grouped by use CALC. FY 2014-15 to FY 2018-19: the plans for these years are printed in Appropriations Reports this page has not read, so each row is blank. FY 2024-25 and FY 2025-26 print departments only, so overhead is inside the program bar. A transfer is counted once, as money leaving the fund.

Source: JBC Staff Appropriations Reports. Editions: FY 2020-21, FY 2021-22, FY 2022-23, FY 2023-24, FY 2024-25, FY 2025-26, FY 2026-27. Table: “Summary of Appropriations and Transfers from the Marijuana Tax Cash Fund”, first column, the year as amended.

Show the plans as a table
Each fiscal year’s final plan from the fund, by use
Fiscal yearDepartment programsOverhead linesTransfers to the General FundTransfers to school construction (BEST)Transfers to school operating fundsOther transfers, netFinal planFACT
FY 2019-20$150.2M$5.8M$0$0$2.5M$0.8M$159.2M
FY 2020-21$115.5M$6.3M$137.0M$0$2.5M$4.8M$266.2M
FY 2021-22$143.5M$7.6M$0$50.0M$0$5.3M$206.5M
FY 2022-23$150.1M$8.2M$0$0$0$0.6M$158.9M
FY 2023-24$146.7M$8.9M$0$0$0$0.6M$156.2M
FY 2024-25$143.7M$0$0$0$1.6M$145.3M
FY 2025-26$124.7M$0$0$0$3.8M$128.6M

The 2012 campaign · Amendment 64

What the campaign’s own ads told voters

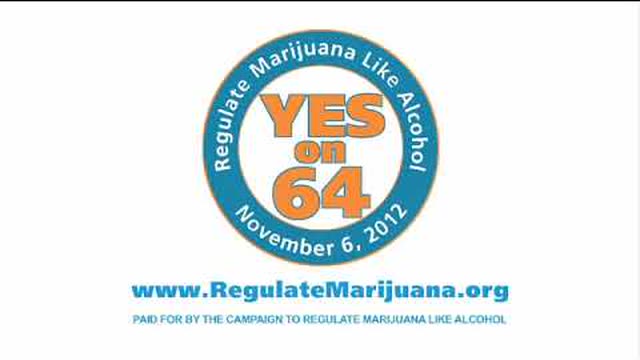
The Blue Book is what the state told voters. The campaign for Amendment 64 made its own case on television, in five 30-second ads posted to its YouTube channel in 2012. Each closes on the card PAID FOR BY THE CAMPAIGN TO REGULATE MARIJUANA LIKE ALCOHOL FACT. One, “Vote for Colorado”, put money on screen. Its claims are set beside the Department of Revenue’s record of the taxes, February 2014 to August 2026. License fees are left out, because the ad speaks of tax revenue.

The money claims, beside the record

Facts set side by side, not a finding of fault.

What the ad said FACTMore than $400 million annually in unregulated marijuana salesOn screen, the opening card, with “Source: Campaign estimate based on government marijuana use data”. Read 27 October 2026 from YouTube’s own still of the ad.
The record now Not tested. It is a claim about sales made outside the law in 2012, and no state record counts those. The record on this page begins with the taxed market in February 2014.
What the ad said FACTMarijuana tax revenues post-2017 could top $100 million annuallyOn screen, with “Source: Colorado Center on Law and Policy analysis, August 2012”
The record now CALCExceeded, and sooner than the ad said. Marijuana taxes were $88.2M in FY 2014-15, the first full year, and passed $100.0M in every fiscal year from FY 2015-16: $251.0M in FY 2017-18, a peak of $425.2M in FY 2020-21, and $221.0M in FY 2025-26.
What the ad said FACT$40 million annually for public school constructionOn screen; no source printed
The record now CALCMet in every fiscal year from FY 2015-16: school construction received $40.0M to $97.3M a year from then on, and $23.9M in FY 2014-15. The $40.0M is the constitution’s floor for the excise tax. School construction is capital money: it builds and repairs school buildings.
What the ad said FACTColorado currently ranks 35th among states in school fundingOn screen, with “Source: Is School Funding Fair? A National Report Card, Education Law Center, June 2012”
The record now CALCNot tested here: whether the ranking moved needs the later report cards, which this page has not read. What the record shows is what kind of money reached schools. CPR News (Colorado Public Radio) reported in 2018 that virtually no marijuana money goes into schools’ operating budgets. DOR’s columns show some did, from FY 2017-18: $228.9M of retail sales tax to the State Public School Fund, which pays for school finance, and $80.3M of excise tax in FY 2020-21 (JBC Staff Budget Briefing FY 2023-24, Marijuana Policy Overview (14 November 2022), PDF p. 7).
What the ad said FACTlet’s have marijuana tax money go to our schools rather than criminals in MexicoVoiceover, as YouTube’s automatic captions report it
The record now CALCOf $3.11B in marijuana taxes from February 2014, $989.1M (31.8%) went to school funds: school construction $612.3M; the State Public School Fund $309.2M; and the permanent Public School Fund $67.6M. No fiscal year sent half: the highest share was 39.0% in FY 2017-18, and FY 2025-26 was 27.3%.
What the ad said FACTregulating the sale of marijuana will allow law enforcement to direct resources towards serious crime“Safer Communities”, voiceover, as YouTube’s automatic captions report it
The record now Not tested. The ad names no dollar figure, and the records on this page cover the taxes and where they went, not how police spend their time.

“Dear Mom”, “It's Time” and “Protect Veterans” make no claim about money. Two uploads each call themselves the campaign’s first television ad: “Dear Mom” (10 May 2012) and “Vote for Colorado” (6 October 2012). On YouTube we found no television ad, from either side, for Proposition AA, the 2013 measure that asked voters for the two marijuana taxes. We also found no ad against Amendment 64 that made a claim about money.

Show the sources for the ads
How we figured this
  • Allocation is each destination’s share of every marijuana tax and fee dollar Colorado distributed in the year. It comes from the Department of Revenue’s monthly reports, July to June CALC.
  • Delivery sets the fund’s final plan FACT beside what was paid. The plan is its appropriations: money the legislature authorized to be spent, in the Long Bill and every other bill, after the next session’s changes. Paid is every payment the state’s ledger, TOPS, charges to the fund in the same twelve months CALC. Plan and paid are two readings side by side and are never added. A difference is computed only for a whole year against that year’s final plan.
  • Purpose is the share of the fund’s final plan in department programs, in overhead lines, and in transfers out of the fund CALC.
  • Plan is the final plan less the plan at enactment: what the next session changed CALC.
  • Carry, what each year left in the fund, needs the State Controller’s year-end statements for the fund. It is not a card until they are read.
  • Exhibits 1 and 2 start at legalization: February 2014, the first month of retail sales and of the Department of Revenue’s reports. They run through the latest month reported. A part year is labeled with its months. The fund’s plans are read from FY 2019-20, so the findings that rest on plans start there.
  • The ads do not play on this page. Each shows a still from the ad, served from this site, and links to the ad where it is hosted, in a new tab. Nothing on this page loads from YouTube or Google.
  • Every dollar figure is rounded: billions to two decimals, millions to one, under $50K in thousands. A department table prints exact whole dollars, and says so.
  • TOPS is read without payees. This page names departments only.