Where will $5.41 billion
of Denver’s money go?
Denver’s Final 2026 budget puts total net expenditures, all funds, at $5.41 billion. That is the book’s own “more accurate picture” of city spending, net of the money the city pays itself. The city publishes five true citywide totals for the same year, so every figure on this page is labeled with its quantity, every time it appears.
This is the City and County of Denver’s own budget, adopted by the Denver City Council. It is not part of the State of Colorado’s budget. The two are never added together: some state money reaches the city, so a sum would count it twice.
Your post
Where will $5.41 billion of Denver’s money go? Denver's city budget, read from the city's own budget book, in plain English. #DenverWorksBetter #TaxpayerShareholder #ShowYourWork
https://colorado.worksbetter.org/denver
Copy this address:
Compare Denver with other cities →
Where $100 goes, by fund group CALC
| Fund group | Per $100 |
|---|---|
| General Fund | $28.38 |
| Enterprise funds | $21.72 |
| Appropriated special revenue funds | $16.57 |
| Capital projects funds | $16.24 |
| Debt service funds | $14.75 |
| Internal service funds | $2.34 |
| Total | $100.00 |
Enterprise funds are the operations that pay their own way — the airport is most of it — so a large share here is not tax money. The General Fund slice is the estimated-expenditures quantity, because that is the figure the city’s fund breakout carries.
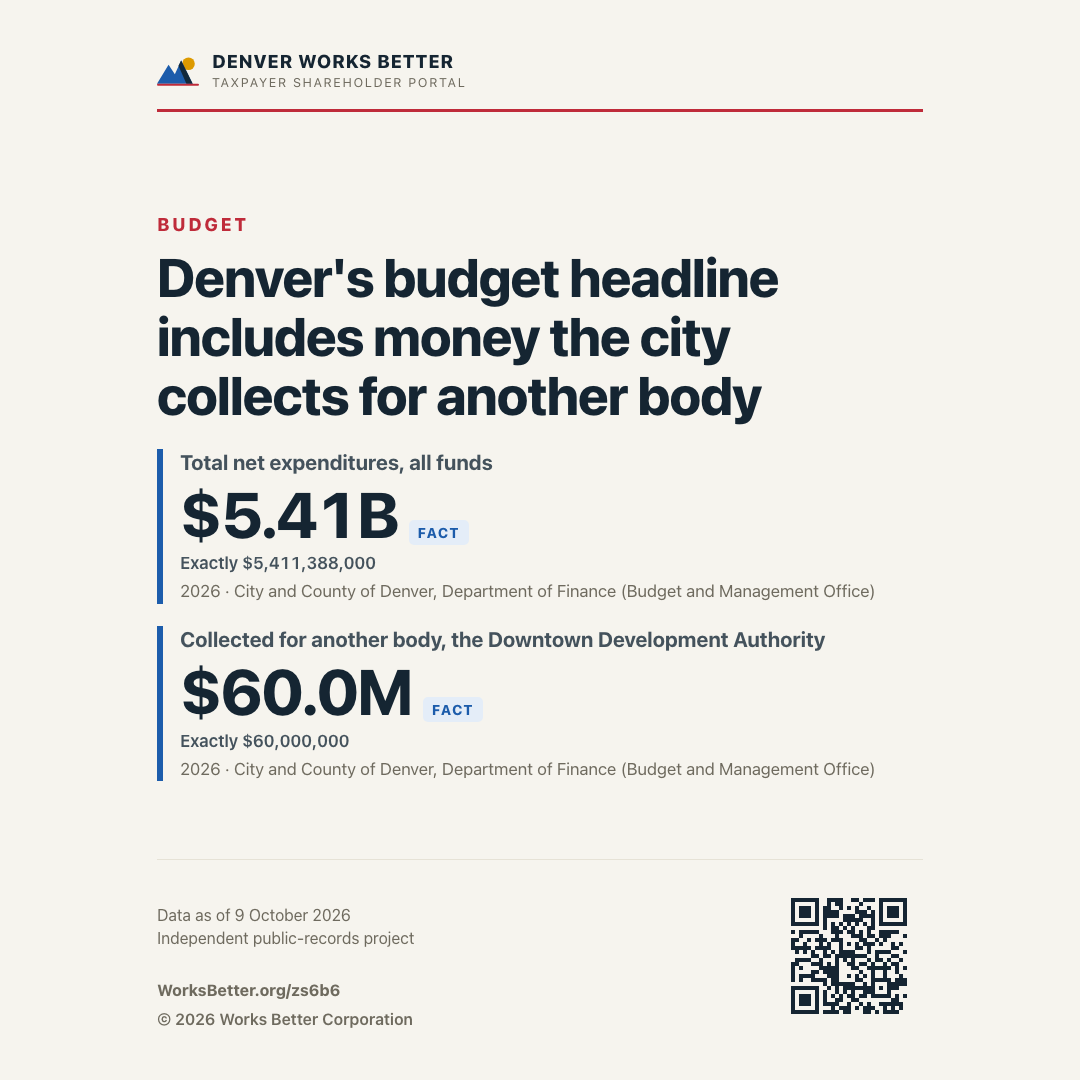
$60 million of the net total, 1.11%, is collected for another body. It is tax-increment money that belongs to the Denver Downtown Development Authority. The city budgets it, and the Authority owns it. CALC $60,000,000 ÷ $5,411,388,000 (total net expenditures, all funds, 2026) = 1.11%. Over the $5,858,807,000 gross, the same $60,000,000 is 1.02%. Source: the Final 2026 budget book, project 38383 in the Capital Projects Funds summary and its description (pp. 736–737).
What this total counts
Denver collects some money for other governments. Three choices decide what the total above includes. Each one is stated here so a reader can disagree with it.
- The Downtown Development Authority’s money is counted as passed through. The $60,000,000 is that Authority’s own tax-increment revenue, so it is its money and not the city’s. Source: the Final 2026 budget book, project 38383, Capital Projects Funds summary and project descriptions (pp. 736–737).
- The Denver Health fund is counted as Denver’s own money. The $67,659,469 Denver Health and Hospital Authority Tax Fund comes from a 0.34% sales and use tax. Denver voters approved that tax in 2024 (Ballot Measure 2Q) and dedicated it to Denver Health. It is Denver’s tax, set by a vote, so it stays in the total and is not called passed through. At most this amount reaches Denver Health, because the fund also pays 1.50 positions of administration. Source: the Final 2026 budget book, special revenue fund 11892 (p. 439) and ordinance item 11892-6520000 (p. 275).
- Denver Public Schools’ property tax is collected on the same bill, and it is not in this total. Denver’s property tax bill carries 79.602 mills, and 52.274 of them are the school district’s. A mill is $1 of tax for every $1,000 of assessed value. The district’s own budget holds that money, so no part of it is in any figure here. Source: the Final 2026 budget book, property tax levy table (p. 220).
What is deliberately not shown here
- The fifth total is named, not published. The book’s prose also states a $4.4 billion “total 2026 budget for all appropriated funds (less duplications)”. The arithmetic path from the printed fund totals to that figure is not printed in one place. So it is named here as the book’s own words, and not republished as a tile.
- Denver Public Schools is a separate government. The school district — formally School District No. 1 in the county of Denver — levies its own taxes and adopts its own budget. None of its money is in any city figure on this page, and no education figure here is ever derived from the city budget. The district’s own funding, enrollment and graduation rate are published further down, under What the money buys. They are labeled as the district’s and never added to anything above.
- The city’s checkbook is a different basis and is not divided into anything here. Denver’s open-data checkbook records payments — cash going out the door, by payee, one dataset per year through 2025. Payments are not appropriations: no figure on this page divides one by the other, and no 2026 checkbook exists yet. An appropriation is money authorized to be spent.
- The state’s figures about Denver are named as the state’s. Colorado is a locale on this site in its own right, and its pages quote some Denver facts from the same publishers. The household section below, What a household pays, quotes the state’s property tax report and Denver’s own tax publications, as read for the Colorado page. Each line there names its publisher, and none is added to the city’s budget. Every other figure on this page comes from this locale’s own pipeline: Denver’s own records, and the state’s district-by-district school publications. Those print Denver Public Schools as a row of their own.
Your post
Where $100 goes, by fund group. What Denver's city budget pays for, from the city's budget book. #DenverWorksBetter #TaxpayerShareholder #ShowYourWork
https://colorado.worksbetter.org/denver#receipt
Copy this address:
Capital projects
Denver’s own capital money for 2026, from the Final 2026 budget book. The city lists part of it project by project. The Projects page shows each of those projects beside the capital budget it belongs to. Spending by project is not published, so none is shown.
The State of Colorado also spends capital money at sites in Denver. That is a different government’s money. The Projects page lists it below the city’s own, and it is never added to any figure here. State projects in Denver
State highway money paid to the city
CALCThe state’s Highway Users Tax Fund (HUTF) holds its fuel taxes and vehicle fees. Every month the State Treasurer pays each city and county a share of it for its roads. This is what the state paid the City and County of Denver. It is the state’s money paid to the city, and it is not added to the state’s figures, to a county’s, or to any other figure on this page.
Denver is one government, a city and county. The state pays it once, so this is the whole payment. It is not split into a city share and a county share, and it is shown only once.
Source: the state’s payment ledger, TOPS Expenses (opens in a new tab), from the Office of the State Controller. The figures are its Department of Treasury payments from the HUTF to the City and County of Denver. The State Treasurer publishes the same monthly payments in its HUTF payment tables (opens in a new tab). Read on 25 October 2026.
Where the money comes from
FACTDenver’s appropriated governmental funds are the General Fund, the special revenue funds, the debt service funds and the capital funds. By the book’s own table, they expect to take in $3.14 billion in 2026. Sales and use taxes are the largest source, $42.26 of every $100, and property tax brings $20.90. Per resident, that total is ≈ $4,245.
The airport and the city’s other enterprise funds pay their own way and are outside this total. So it is not set against the spending total above. What a household pays in the two taxes it sees directly is in the next section.
What a household pays
Two city taxes reach a Denver household directly: the sales tax at the register and the property tax bill. Each line below names who levies it and where the figure is published. The school district’s share of the property tax bill is shown beside the city’s, and the two are never added together. Property tax figures are amounts levied, not amounts collected.
- FACT City sales and use tax rate: 5.15% of a taxable sale. Source: City and County of Denver, Department of Finance, Treasury Division, Denver Tax Guide Topic No. 70 — Sales Tax (revised 03/2026).
- FACT Combined rate a shopper pays in Denver: 9.15%. This is Denver’s own printed combined rate. It includes shares for the state and for regional districts, and those shares are not Denver’s money. Source: City and County of Denver, Department of Finance, Treasury Division, Denver Combined Tax Rates, effective 1-1-2025.
- FACT Denver’s own property tax levy: 26.328 mills. A mill is $1 of tax for every $1,000 of assessed value. Source: Colorado Governor's Office of Information Technology / Department of Local Affairs, PropTaxMap — Levies (taxing districts/authorities in Colorado).
- FACT Property tax levied for the City and County of Denver, 2025: $685,728,245. CALC That is 29.6% of everything levied on property in Denver, $2,314,333,258. Source: Colorado Department of Local Affairs, Division of Property Taxation, 2025 Fifty-Fifth Annual Report to the Governor and the General Assembly.
- FACT Levied for the school district on the same bill: $1,441,397,716. CALC That is 62.3% of the total. It is Denver Public Schools’ money, not the city’s, and it is never added to the city’s figure. Same source as the line above.
- CALC The remaining 8.1% of what is levied in Denver goes to other bodies on the same bill, such as special districts. It is not listed line by line here: $2,314,333,258 less the city’s and the school district’s amounts, over the total.
- CALC City property tax per resident: ≈ $926. $685,728,245 ÷ 740,613 residents (Census, 2025). It is levied, not collected, and residents are not the only payers: businesses pay property tax too.
Why this exists
Denver WorksBetter exists so any resident can see where public money goes, in plain English. Every figure names its official source, and a figure we cannot source stays blank.
The headline total is $5.41 billion of net citywide spending. Denver publishes five true citywide totals for 2026, and the press usually headlines a fifth — so every figure here is labeled with which quantity it is, every time it appears. Denver is a consolidated city and county: one government on one boundary. That makes it the one place on this site where the city and the county are the same answer.
Weekly reports
PENDINGThe first brief has not been written
Rather than show an example of what one might look like, this space stays empty until a real one exists. A sample brief on a page like this is indistinguishable from a real one at a glance, and the whole point of this site is that you never have to guess which you are reading.
Tell us to notify you.
Leave an email and we will tell you when the first brief is published. We are not promising a weekly cadence, or any cadence, until one has actually shipped.
No Denver brief exists yet. This sign-up records your address so we can tell you when the first one is published.
The corrections log
- Oct 16 · The crime-rate notes said the Colorado and U.S. lines divide by a “matched population.” They divide by the FBI’s population for the whole state or nation. The notes behind the Denver crime charts, on Ask, said the Colorado and U.S. rates divide reported offenses by the FBI’s “matched population,” and that the city’s own rate does not. The city’s rate divides by the population the police department serves, and that part was right. The population the FBI returns with those counts is every resident, not only those whose police agencies reported, and that is the one we used. No rate changed. Colorado’s own pages carried the same wording and were corrected on 15 October.corrected
The log begins on 16 October 2026. The most recent was 16 October 2026. Last checked 16 October 2026. The full log, on a page of its own